Meta-analyses. So much meta, many analyses. I’ve done a few, two are under review, and two almost ready for submission. Red thread in this is the Comprehensive Meta-Analysis (CMA) meta-analysis software package. CMA has brought the practice of meta-analysis (or ‘an exercise in mega-silliness‘, as Eysenck called it) to a broader audience because of its relative ease of use. Downside of this relative ease of use is the unbridled proliferation of biased meta-analyses that serve only ‘prove’ something works, but let’s not get into that – my blood pressure is high enough as it is.
Some years back, CMA changed from one-off purchases to an annual subscription plan, ranging from $195-$895 per year per user, obviously taking hints from other lucrative subscription-based plans (I’m looking at you, Office365). Moreover, CMA has a number of very irritating bugs and glitches: just to name a few, there’s issues with copying and pasting data, issues with not outputting high-resolution graphics but just a black screen, issues with system locale, etc. etc. On the whole, CMA is a bit cumbersome and expensive to work with, and I’ve been telling myself to go and learn R for years now; if anything to use the Metafor package, which is widely regarded as excellent.

However, I never found the time to take up the learning curve needed for R (i.e., I’m too stupid and lazy), and while recently whining on Twitter about how someone (most definitely not me) should make a graphical front-end for R that doesn’t pre-suppose advanced degrees in computer science, voodoo black arts and advanced nerdery; Wolfgang Viechtbauer pointed me to JamoviMeta.
In my quest to find a suitable alternative to CMA that even full-on unapologetic troglodytes like me can understand – let’s give it a test drive!
DISCLAIMER: Most of the time I have no idea that I’m doing, as will be readily apparent to any expert after even a cursory glance.
INSTALLING AND FIRST GLANCE
I was redirected to a github page, which instructed me to first download Jamovi, and add the module MetaModel.jmo.
Never heard of Jamovi before, but let’s give it a shot – the installer seems straightforward, MetaModel is an add-on for the Jamovi software package, which is itself a fairly new initiative at an “open” statistics package. I’m not entirely sure if Jamovi itself is an add-on to R, but at this point that’s not particularly relevant for what I want to do.
The main screen of Jamovi looks simple, clean and friendly. Now, to ‘sideload’ MetaModel. Nothing in the menu so, click Modules, sideload, find the downloaded MetaModel.jmo and import it.
ENTERING DATA
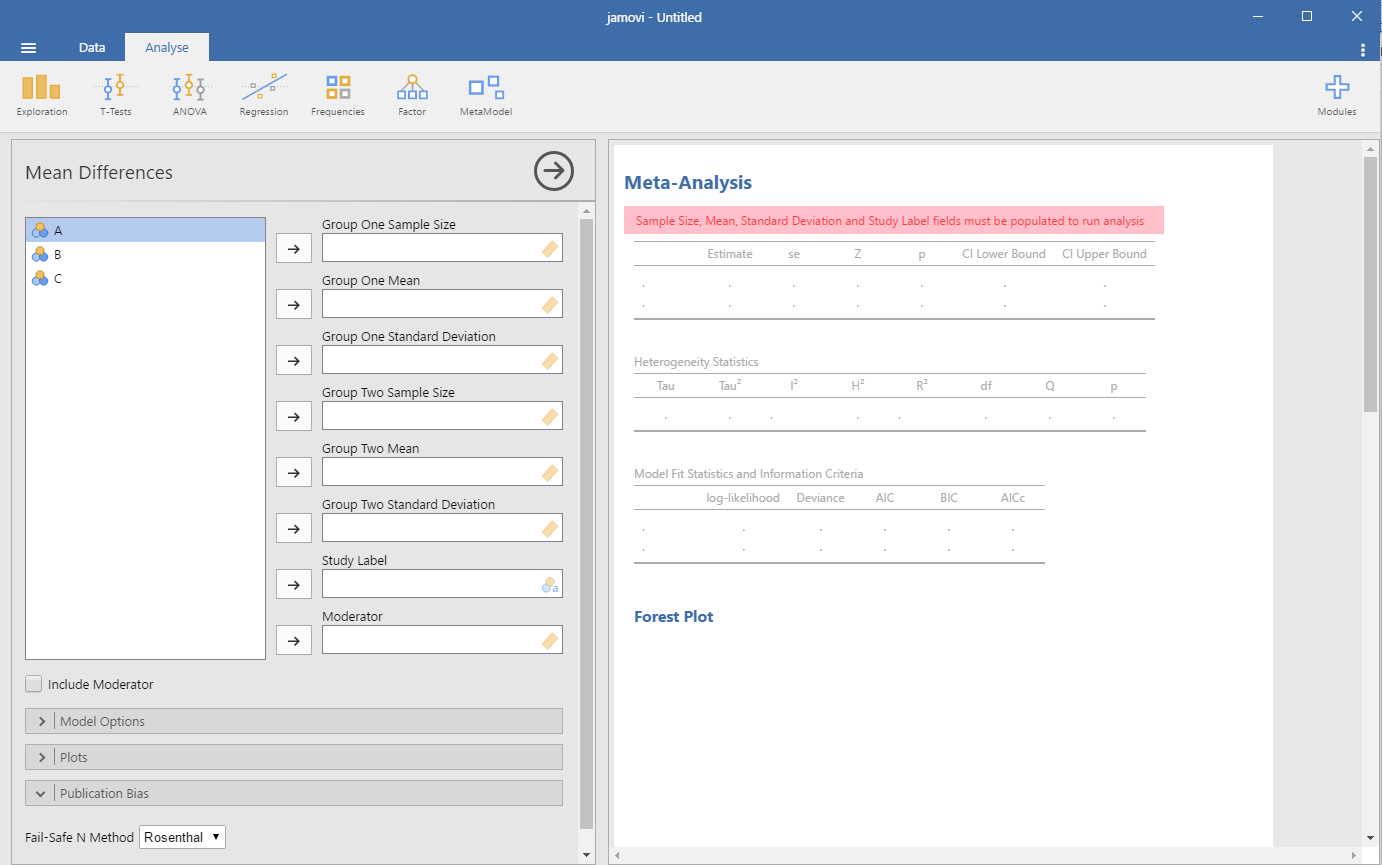
It’s not immediately apparent where I should start – the boxes with labels like “Group one sample size” look inviting as text boxes, but entering information doesn’t work. Using the horizontal arrow to shift the 3 bubbles with “A” on the left panel to the right doesn’t work and flashes the little yellow ruler(?) in the text box which isn’t a text box.
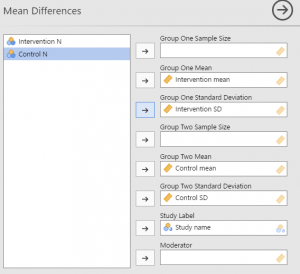
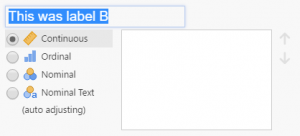
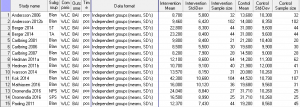
The grey arrow pointing to the right brings me to a spreadsheet-like… Well, spreadsheet. Ah! The A, B, C refer to columns in this spreadsheet, and the software’s expecting data as you’d expect: study name, sample size, mean, standard deviations. Jamovi seems to automatically recognise the type of data I’ve entered, but also seems thrown off by my use of a comma instead of a period. Incidentally, this is/was a major issue with CMA, which depends your computer’s ‘locale’ settings – if you’re from a country that uses dots for thousands and commas for decimals (eg, €10.000,00) and you send a data file to a colleague who has US numbering (eg, $10,000.00), the data would be all screwed up. Adding variable labels isn’t immediately apparent either, but double-clicking a column header and then double clicking the letter of the column lets you change the label.
Having entered the data, I go back to “Analyse”, and try to enter my newly made data into MetaModel. Everything works, except… It won’t accept the sample sizes for my data. When I try to, it flashes the yellow ruler (?) in red – Ah, this probably means it wants continuous data, but the sample sizes had been interpreted as ordinal data as denoted by the three bubbles (same icons as in SPSS).
This being corrected, MetaModel goes straight to work (apparently), and tells me “Need to specify ‘vi’ or ‘sei’ argument”. Well obviously. More random clicking is in order, I think – that’s never failed me, since psychology students are taught to keep clicking until the window says p<0.05 or smaller*). I’ve only just entered data, and haven’t actually told MetaModel what to do so it’s no surprise that nothing works.
I flip open ‘Model options’, ‘plots’ and ‘publication bias’.
…I quickly close ‘publication bias’ again, as it only shows options for Fail-safe N. Let us never mention Fail-safe N again, and I hope the developer removes this option ASAP. I am aware of the current discussion of how Trim & Fill probably doesn’t work very well either (nor does anything else, apart from 3PSM apparently, but I think everyone can probably agree that Fail-safe N should never be used.
Clicking around a bit (I won’t go into all the different types of meta-analysis model estimators), I find out that I have to choose either ‘Raw Mean Difference’ or ‘Log Transformed Ratio of Means’ to make the “Need to specify ‘vi’ or ‘sei’ argument” message go away. Not sure what this is about. However, all this looks encouraging, and it’s time for real data.
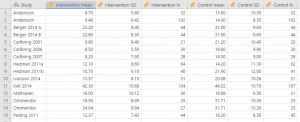
I prepared a small data file in CMA, based on a meta-analysis we’re currently working on, using Excel as an intermediary as CMA’s data import/export capabilities as non-existent and I need to change all decimal commas to decimal points, and copy-paste the data into MetaModel. Small issue: there’s no fixed column for subgroups within studies (or maybe I’m just doing it wrong, so I renamed the studies into Kok 2014, A, B, etc.
THE ANALYSES
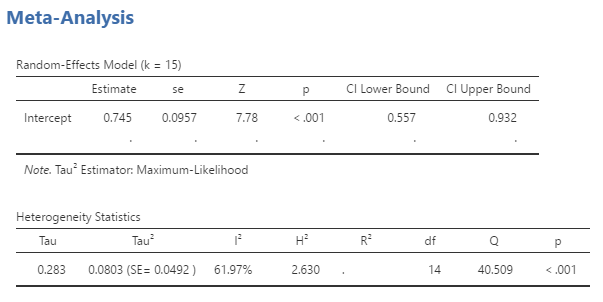
However, running the analyses from here on was straightforward, easy and quick. The results are pretty much consistent with CMA (I used a DerSimonian-Laird model estimator, I think that is the CMA standard). I saw no strange differences or outliers, apart from a few (not particularly large) differences in effect sizes. These are probably due to subtle differences in calculations, but I take it both CMA and MetaModel have their own set of assumptions for calculations which explain the small variations. Kendall’s tau was even spot on.

EXPORTING OUTPUT
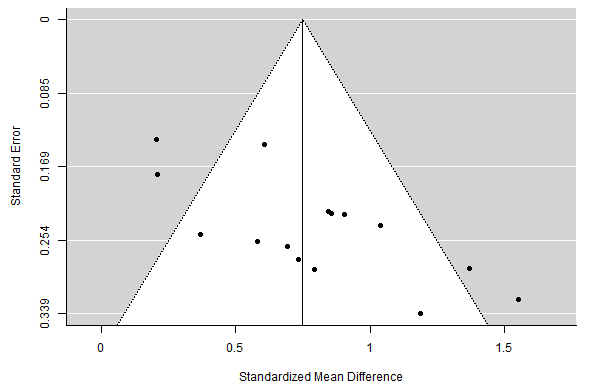
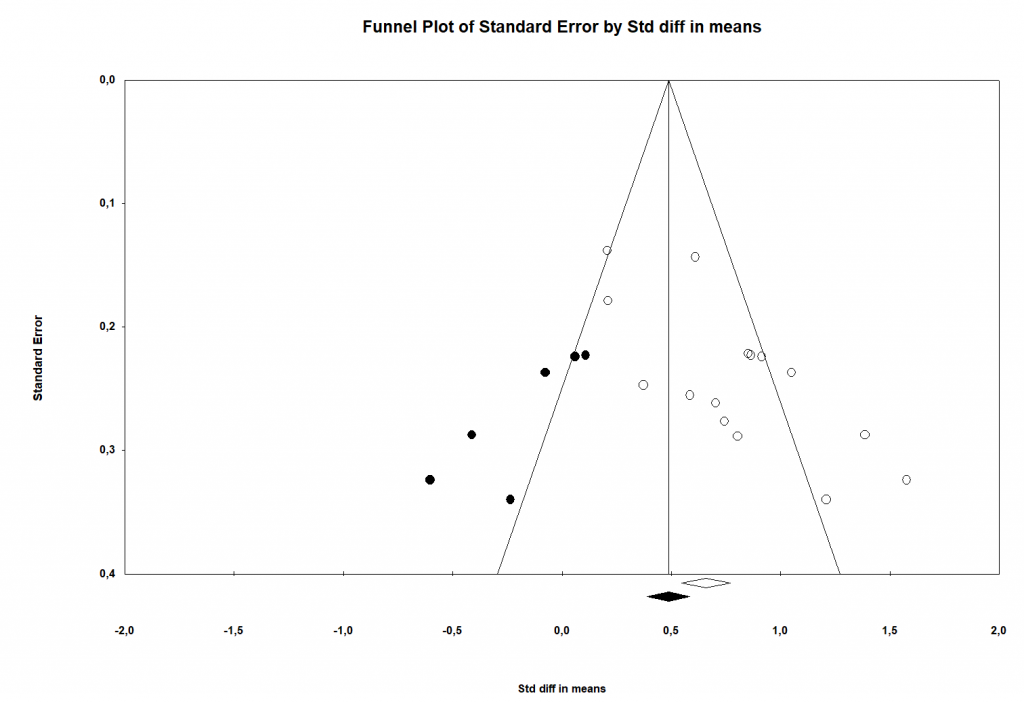
MetaModel has tackled one of my biggest gripes with CMA: high-quality images. Unhelpfully, CMA’s so-called ‘high resolution’ outputs have been quirky, ugly and too low resolution for most journals as it would only export to Word (ugh), Powerpoint (really?) and .WMF (WTF?). In MetaModel, right-clicking e.g., the funnel plot gives you the option
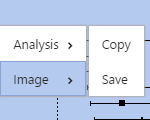
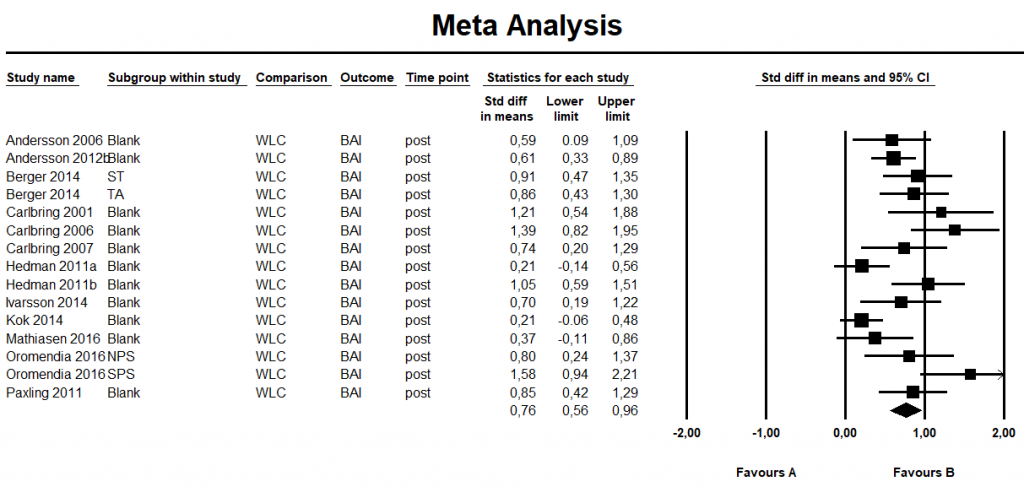
to export the image to a high-quality PDF which looks crisp and clear (download sample PDFs of the MetaModel funnel plot and MetaModel Forest plot here).

THE VERDICT:
If this is a ‘beta’, it looks and work better than OpenMetaAnalyst ever did (although to be fair, I should revisit that some time). The developer (Kyle Hamilton) has done an impressive job in coding relatively simple, but very usable module for meta-analysis. It is lightyears faster than CMA (which can crawl to a virtual stand-still on my i3 laptop) and can output high-quality graphics. Also, it does real-time analyses so there’s no need to keep mashing that “-> Run analyses” button after making small changes. Choosing Jamovi as a front-end was a good bet – its interface looks friendly modern and crisp. Of course, features are missing and this was just a very quick test run, but my first impression is very good. I’d very much like to see where this is going.
THE GOOD:
- Pretty much MWAM (Moron Without A Manual) proof.
- Feels much more modern than CMA. Looks better. MUCH faster.
- More model estimators than CMA.
- Contour-enhanced funnel plots and prediction intervals. Nice addition.
- So far, no glitches or crashes.
- It’s free!
THE BAD:
- Hover-over hints (contextual information if you hover over a button) would be nice
- Error messages aren’t especially helpful
THE UGLY:
- Fail-safe N.
THE REQUESTS:
- Modern alternatives for publication bias, e.g. p-curve, p-uniform, PET(-PEESE) or 3PSM.
- 95% CIs around I²
- Support for multiple subgroups and timepoints?
*) Only a slight exaggeration: this is what students teach themselves.

One thought on “Robin looks for meta-analysis alternatives 1: JamoviMeta.”